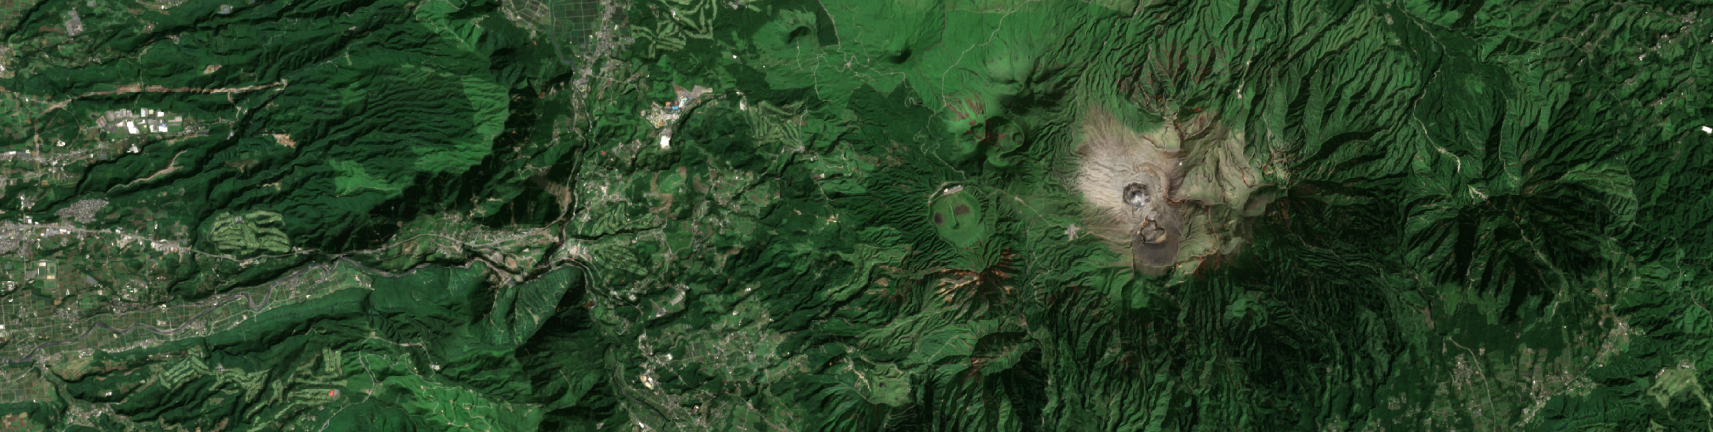
Given enough data and compute budget, there’s a sure-fire way to remove all cloud cover from Sentinel-2 satellite imagery. By enough data, I mean a whopping 5 years worth of imagery. It’s fairly overkill, to put it mildly, but it works: every time, everywhere.
Project Description
I created a process that outputs clear-sky satellite images of ANY location on the globe. The process is fully automated and can return a clear tile given a Setninel-2 cell. It even works for locations that are typically hard to process, like the tropics where there is almost year-round cloud cover. Read on to see examples and find out how I put this project together.
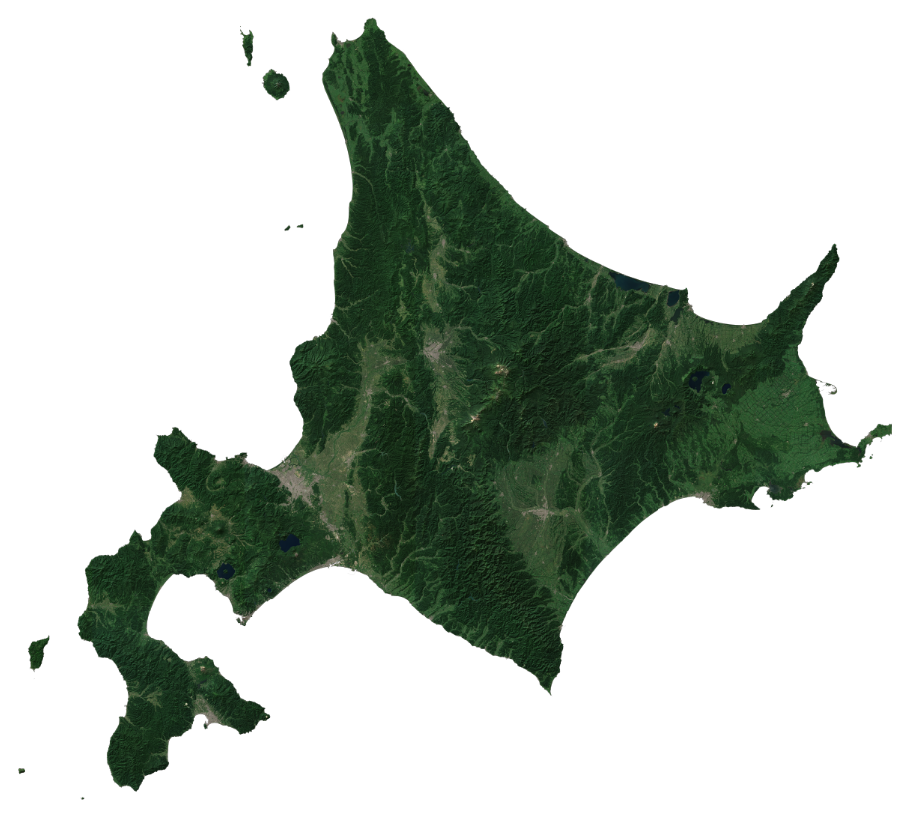
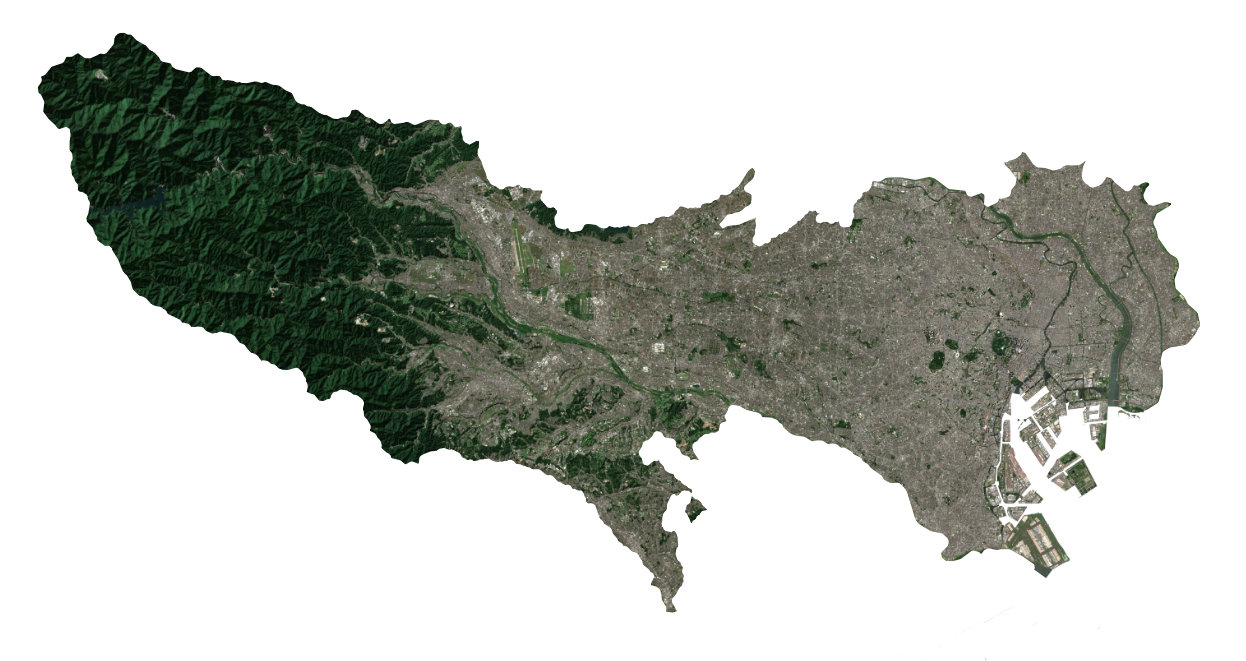
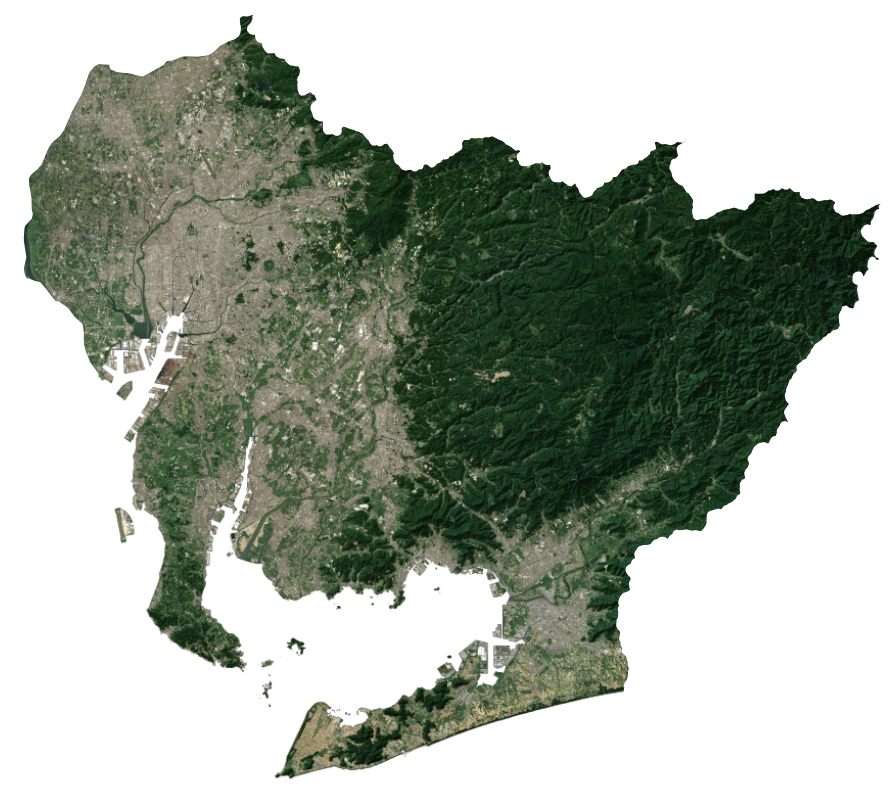
Composite images of Hokkaido, Tokyo, and Aichi Prefecture, Japan.
Processing Technique
The dataset I used for this project was Sentinel-2’s level 2 product. This imagery is already calibrated to surface reflectance and is very close to the “true” colors you would see on the surface of the planet. A big bonus is that the data is completely free to use and hosted for free on AWS too.
Creating cloud free images from Sentinel-2 data is actually very easy. A common technique is to take the 25th percentile value from a stack of satellite image pixels. This article on generating a cloud free image of New Zealand describes how the technique works in detail. It’s possible to generate nearly cloud free imagery almost anywhere using this very, very simple approach.
Almost, anywhere.
I was always bothered with how this technique would fail for regions that typically have a lot of cloud cover: mountainous terrain or areas around the tropics. For most production cases, it’s probably not worth the extra work to deal with cloud cover in this area, but this is a personal project and I wanted to see if I could develop a sure-fire way of removing all cloud cover.
It turns out that a modified version of the 25th percentile technique along with a very heavy handed use of almost all Sentinel-2 data can remove the last vestiges of cloud cover pixels. My process needs on average 100 Sentinel-2 tiles (5 years worth of data during summertime months). The vanilla percentile technique can achieve similar results with around 10 tiles! Needless to say, the process I developed is severe overkill. That said, I can run it in my sleep and it will ALWAYS produce a clear image. The same cannot be said for the vanilla technique.
In addition to a large stack of Sentinel-2 images, my process also requires fairly accurate cloud cover masks. I found that the landcover classification layer included in the Sentinel-2 dataset wasn’t sufficient to mask out all cloud cover, so I trained my own cloud detection model. I hand selected a few tiles that had decent landcover masks and trained a transformer based model available from the awesome Huggingface library. After that, I fed the model each Sentinel-2 tile and created corresponding cloud masks.
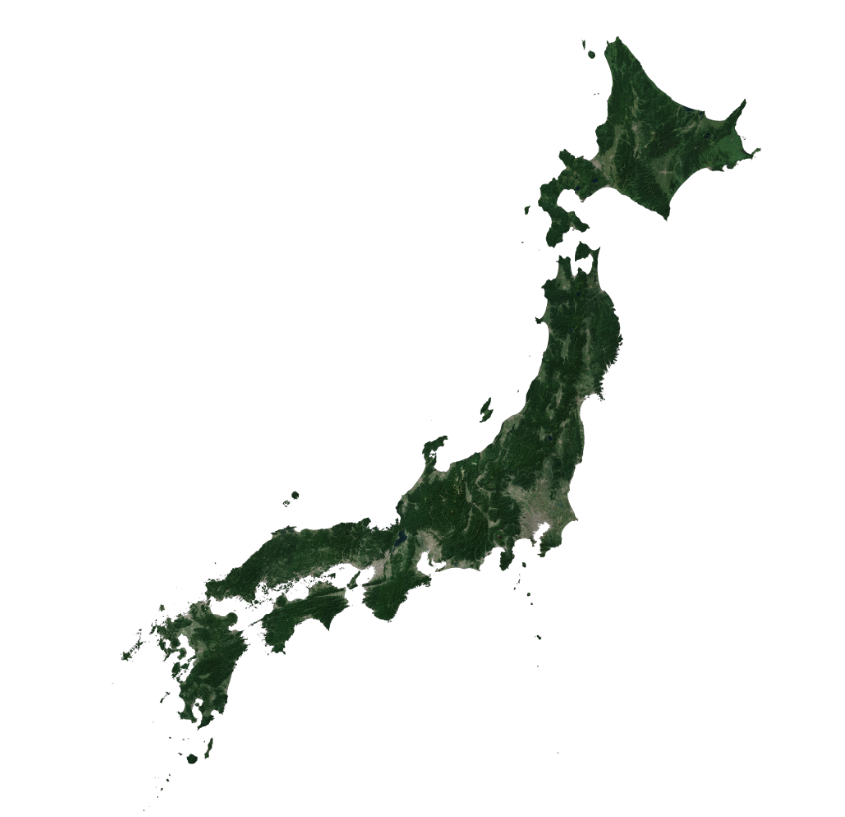
Composite output over Japan.
The final step to creating cloud free images requires combining the cloud mask with the vanialla 25th percentile technique I mentioned in the beginning. Sounds simple, but this process is insanely slow when using a built in method in Numpy. Thankfully, a talented individual by the name of Kersten Fernerkundung created an excellent algorithm to do the heavy lifting. His work imprecisely approximates Numpy’s nanpercentile function, but brings the run time down from quadratic to linear. This algorithm was critical in allowing me to effectively use the cloud masks to compute the 25th percentile value.
Taken together, the above steps allow me to pick any geographic location and generate a completely cloud free image. The results work great even for areas with persistent cloud cover. I’ve only processed Sentinel-2 cells over Japan, but it wouldn’t be too much extra work to parallelize this process on a bunch of servers on cloud computing platforms like AWS or GCP. If I had a few extra bucks to throw at this project I could have the whole globe processed in a few hours. That’s an MLOps project another day.
For now, you can check out a sample of the final output in the map below. I combined the satellite imagery with one of my favorite datasets for Japan: a 10m digital elevation model. The result is a very cool looking basemap that I’m sure would look great with other GIS data overlayed on top. Another interesting visualization project for another day!