JAXA provides free, limited use access to top of atmosphere reflectance and other derived data from the Himawari 8 geostationay satellite. You can request access to the data here. I’ve put together a helper script that downloads the data files from JAXA’s FTP server and extracts one of the bands (cloud top height) as a GeoTIFF. The script can be modified to include your own account ID and password along with the target date for which the script will download hourly data from the JAXA server.
import os
import subprocess
from pathlib import Path
from ftplib import FTP

cwd = Path("local_dir_path")
base = cwd / 'data'

# User authentication to JAXA's FTP server
ftp = FTP('ftp.ptree.jaxa.jp')
ftp.login('account_id', 'account_password')
par_base = '/pub/himawari/L2/CLP/010' # target location on the server
ftp.cwd(par_base)

# Chose a date and download the data, and convert to GeoTIFF
year, month, day = 2015, 7, 4
for hour in range(0,24):
    target_hour = f"{par_base}/{str(year)+str(month).zfill(2)}/{str(day).zfill(2)}/{str(hour).zfill(2)}"
    file_list = ftp.nlst(target_hour)
    file_list.sort()

    for file_path in file_list:
        file_path = Path(file_path)

        download_path = base / file_path.name
        name = file_path.name[:-3]
        output_path = base / f"{name}.tif"
        temp_output_path = base / f"tmp_{name}.tif"

        try:
            # read the data from the FTP server
            with open(download_path, "wb") as handle:
                ftp.retrbinary('RETR %s' % file_path, handle.write)

            command = f'gdalwarp -overwrite -of GTIFF -t_srs EPSG:4326 NETCDF:"{download_path.as_posix()}":CLTH {temp_output_path.as_posix()}'
            subprocess.run(
                            command,
                            shell=True,
                            check=True,
                            stdout=open(os.devnull, "w"),
                            stderr=subprocess.STDOUT,
                        )

            command = f'gdal_translate -co compress=deflate -co predictor=2 {temp_output_path.as_posix()} {output_path.as_posix()}'
            subprocess.run(
                            command,
                            shell=True,
                            check=True,
                            stdout=open(os.devnull, "w"),
                            stderr=subprocess.STDOUT,
                        )

            os.remove(download_path)
            os.remove(temp_output_path)
            print("completed", output_path.name)

        except Exception as e:
            print(e)
            print("failed", output_path.name)
Once the data has been downloaded and processed into GeoTIFFs, it can be further processed for data visualization. The following script uses QGIS3 to generate PNGs with a timestamp label.
from qgis.core import *
from PyQt5.QtSql import *
from PyQt5.QtGui import *
from PyQt5.QtCore import *
from datetime import datetime, timedelta


def clean():
    global count
    test_layers[count].setItemVisibilityChecked(False)
    iface.mapCanvas().refresh()
    QTimer.singleShot(2000, fire)


def fire(base: Path) -> None:
    global count
    test_layers[count-1].setItemVisibilityChecked(False)
    test_layers[count].setItemVisibilityChecked(True)
    name = test_layers[count].name()
    date = datetime.strptime(name, "CLTH_%Y%m%d_%H%M_compress")
    date = date + timedelta(hours=9)
    date_name = date.strftime("%Y.%m.%d %H:%M")

    # change the label
    label_layer = QgsProject.instance().mapLayersByName('label')[0]
    label_layer.startEditing()
    for feat in label_layer.getFeatures():
        label_layer.changeAttributeValue(0, 1, date_name)
    label_layer.commitChanges()
    iface.mapCanvas().refresh()
    iface.mapCanvas().saveAsImage( base / f'{name}.png' )
    if count < len(test_layers)-1:
        QTimer.singleShot(1000, clean) # Wait a second and prepare next map
    count += 1


# Once all data processing has been complete, fire off the PNG creation through QGIS
root = QgsProject.instance().layerTreeRoot()
test_group = root.findGroup('test')
test_layers = list(test_group.children())
count = 1
QTimer.singleShot(2000, fire)
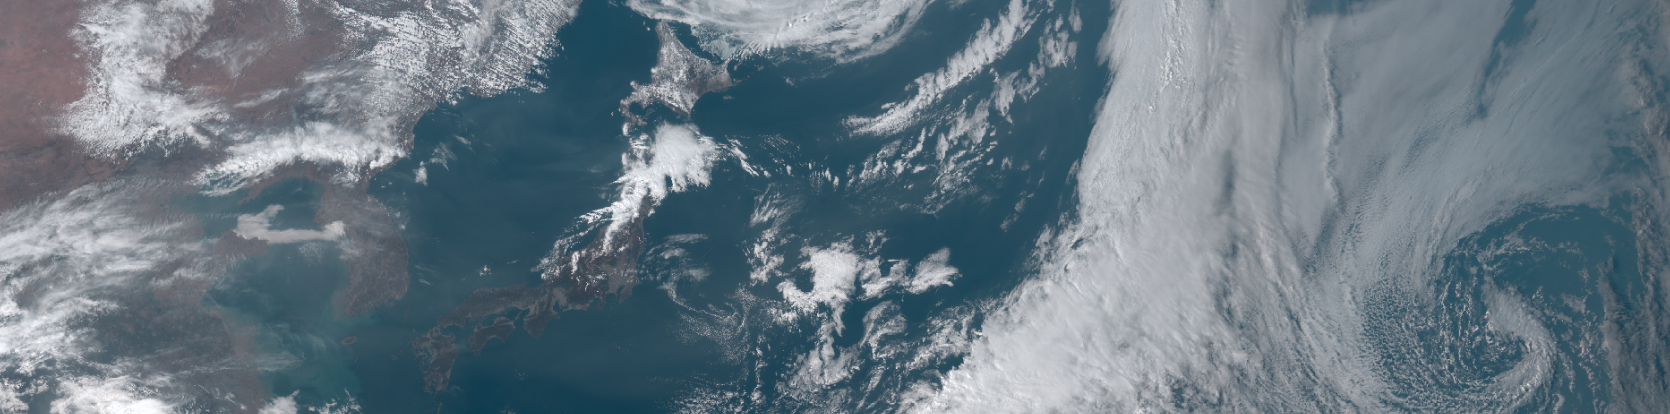
Visualizing Himawari 8 Weather Data Over Japan
The PNG versions of the data can then be fed through ImageMagick to create a GIF. It should be pretty straightforward to modify the first Python script to download 10 minute interval data instead of 1 hour interval data. I downloaded a bunch of data for a particularly interesting day that had 3 typhoons forming over the Pacific Ocean.
There are all sorts of interesting applications for this type of data: one obvious one being weather forecasting. Google has a couple of pretrained models that can handle cloud cover data as inputs and output several hour-ahead forecasts. While Google’s platform uses GOES-16 data, one could easily feed the model Himawari 8 data and create forecasts over Asia. Given the amount of data from JAXA, however, with a little extra work, a hand rolled neural network could be trained to predict the weather. I imagine the results from such a model would make an even more interesting visualization project.
Header photo ©JAXA